Debugging Code
Introduction
Sometimes you will write programs that behave unexpectedly, this is usually because of errors in your code called bugs! Bugs can come from lots of places such as typos or a misconception about how the program will work. To make your programs work you will need to find these bugs and solve them.
This activity will show you how use CodeBug emulator controls and breakpoints to find bugs in your code and ways of solving the problems.

|
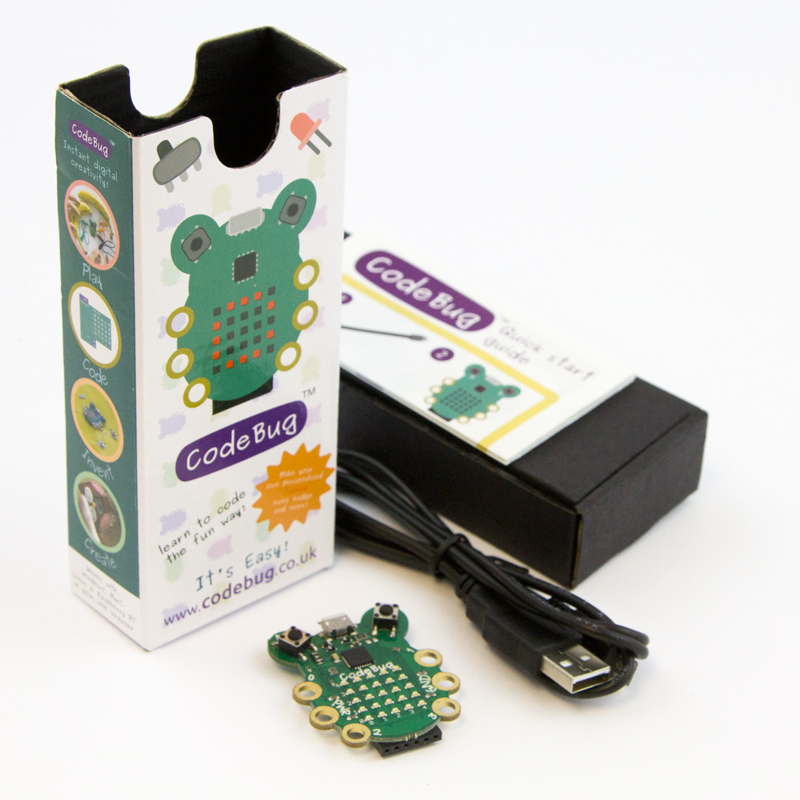
CodeBug | |||
| Micro USB cable | ||||
| Computer | ||||
Emulator controls
The CodeBug emulator is great for debugging your code because it allows you to see what your code will make CodeBug do before loading it onto your bug. The emulator has a couple of controls which you may not have tried before, the Pause and the Step Through buttons.
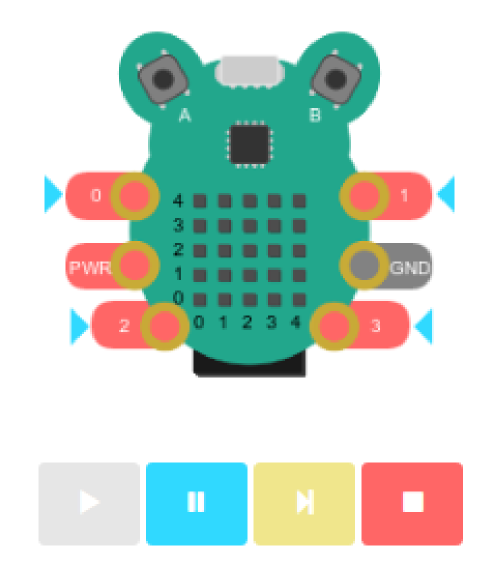
The Pause button will pause the emulator on the current block highlighted.
The Step Through button will run one block each time it is pressed and then pause after that block has been run. This is really useful for knowing exactly what your program does as time progresses.
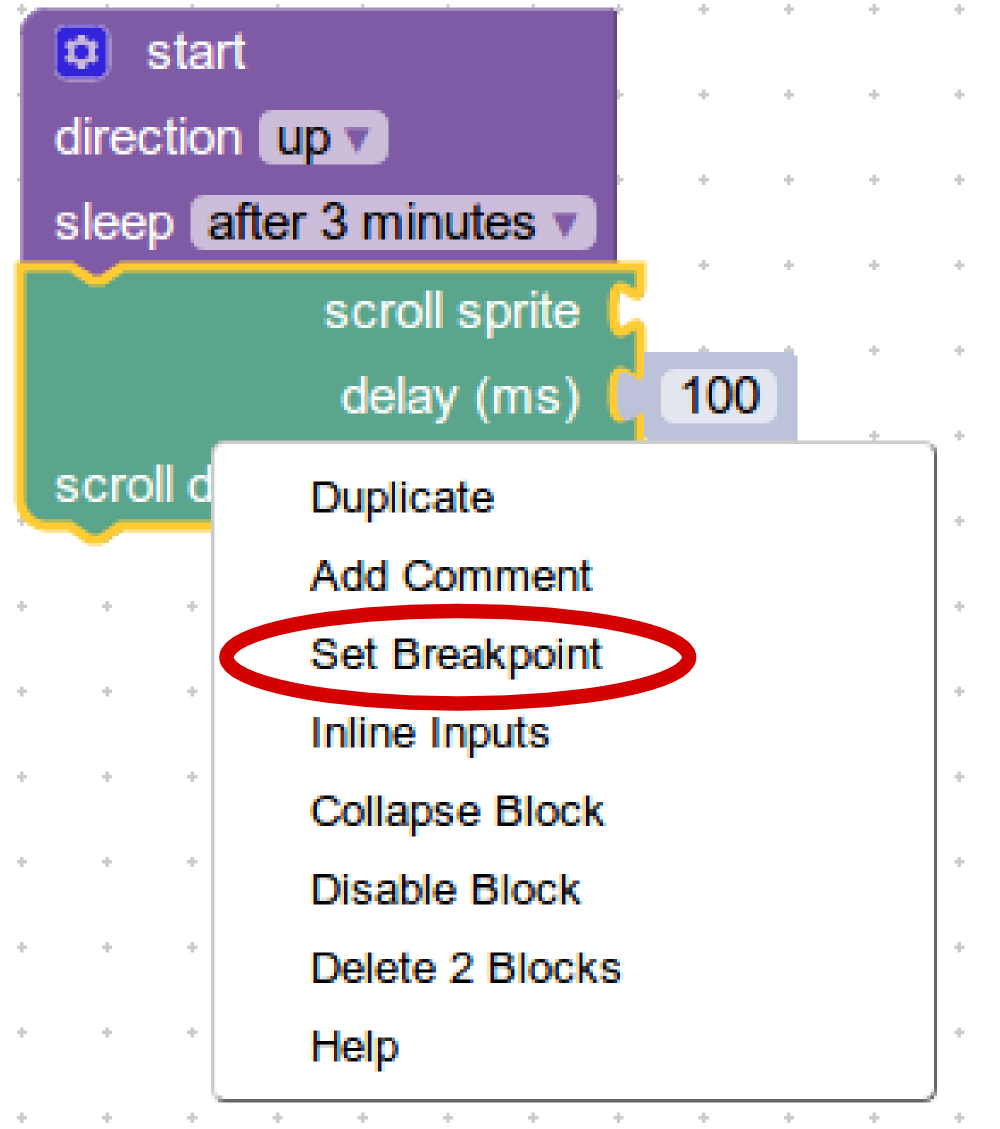
Breakpoints
Breakpoints are a way of pausing your program on a particular block in your code so that you can see what CodeBug is doing after the block has been ran. You usually set breakpoints in places where you think the error could be, or places where you can’t observe an intermediate step of the program.

You can set breakpoints by right clicking the block and selecting "Set Breakpoint" or clicking the breakpoint button next to the undo/redo buttons.
Writing your program
To test these features, follow the tutorial below which has some sample code that we can test and debug.
Tutorial
What next?
Try making a very large complex program (which will likely contain bugs) and use the emulator controls and breakpoints to find the bugs and fix them.
If you are feeling particularly confident, you could even Tweet with #codebug asking the community if they have any programs with bugs they can’t find or fix and have a go at fixing them.